
Blog
From "spend is up" to root cause, without leaving the dashboard
Here’s a real anomaly from the Plutus demo account, and what it actually takes to chase it down to a cause. You don’t need to go looking for it. It’s sitting on the dashboard the moment something crosses the threshold.
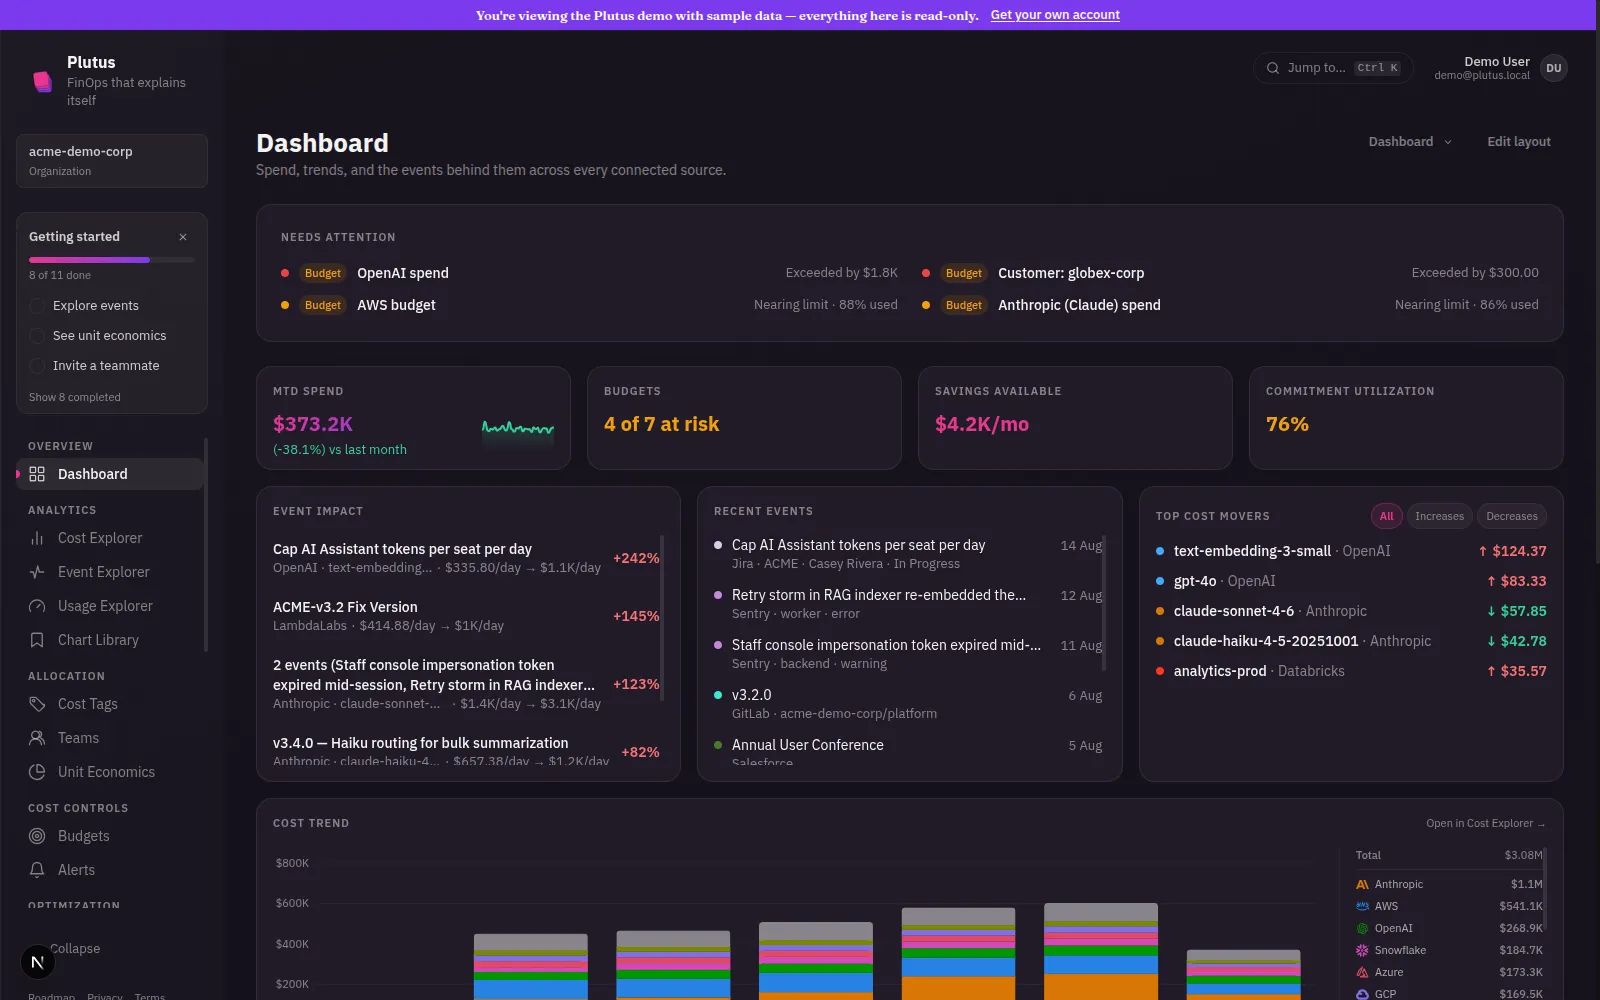
OpenAI’s text-embedding-3-small went from $335.80 a day to $1.1K a day, and Plutus has already
matched it against a Jira ticket with a name that’s practically the answer: “Cap AI Assistant
tokens per seat per day.” That match isn’t a naive yesterday-vs-today comparison either, which
would flag every single Monday. It’s checked against the account’s own day-of-week pattern, so
what got flagged here was unusual.
Click into it and you land in Cost Explorer, filtered down to OpenAI, and the shape of the thing gets a lot clearer.
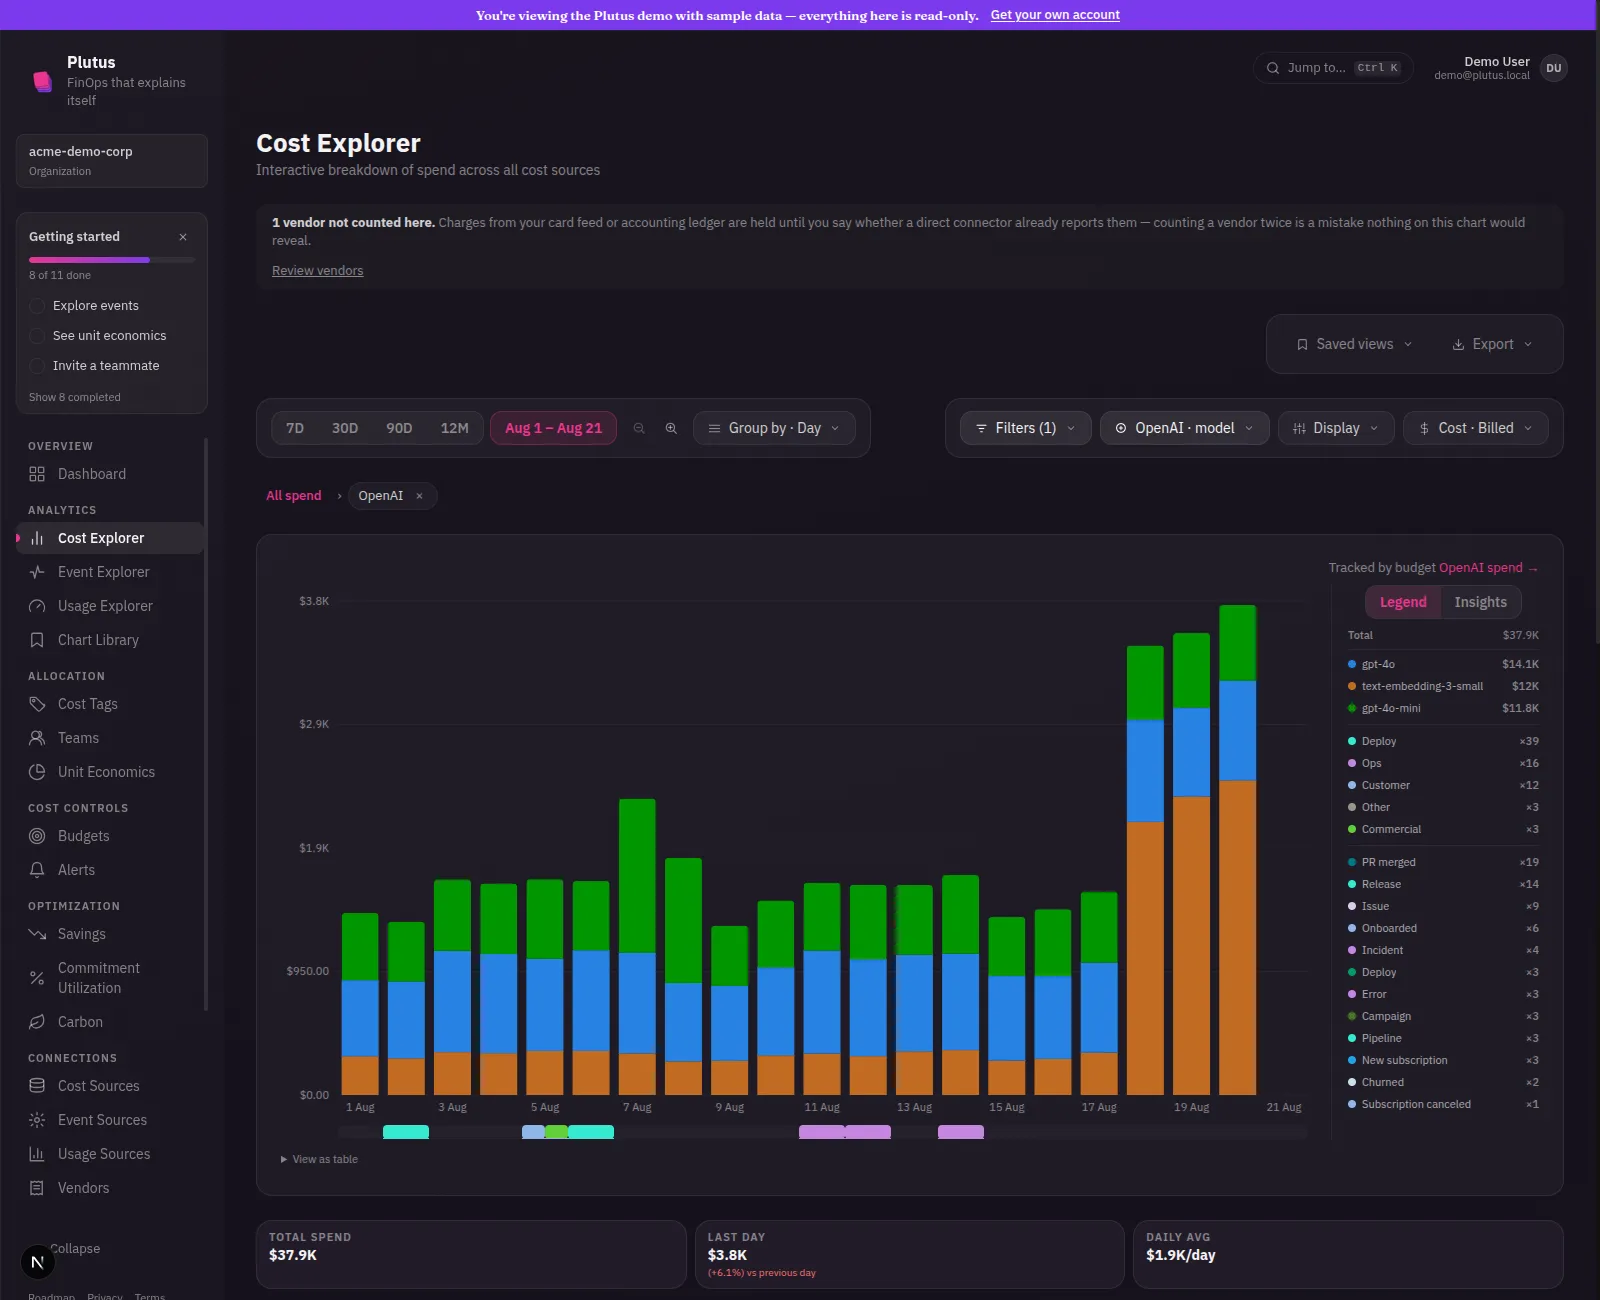
Three models stacked in this chart, and only one of them is doing anything. The orange band,
text-embedding-3-small, is carrying almost all the growth in those last three bars. Everything
else is flat. That’s already more useful than “OpenAI spend is up”: one specific model, which
tells you this account started embedding a lot more, not chatting a lot more.
Now you want to know what changed, and you don’t have to leave the chart to find out. Events sit right on the timeline, so clicking the day the line starts climbing pulls up the same ticket the dashboard already named, this time with the full context attached.
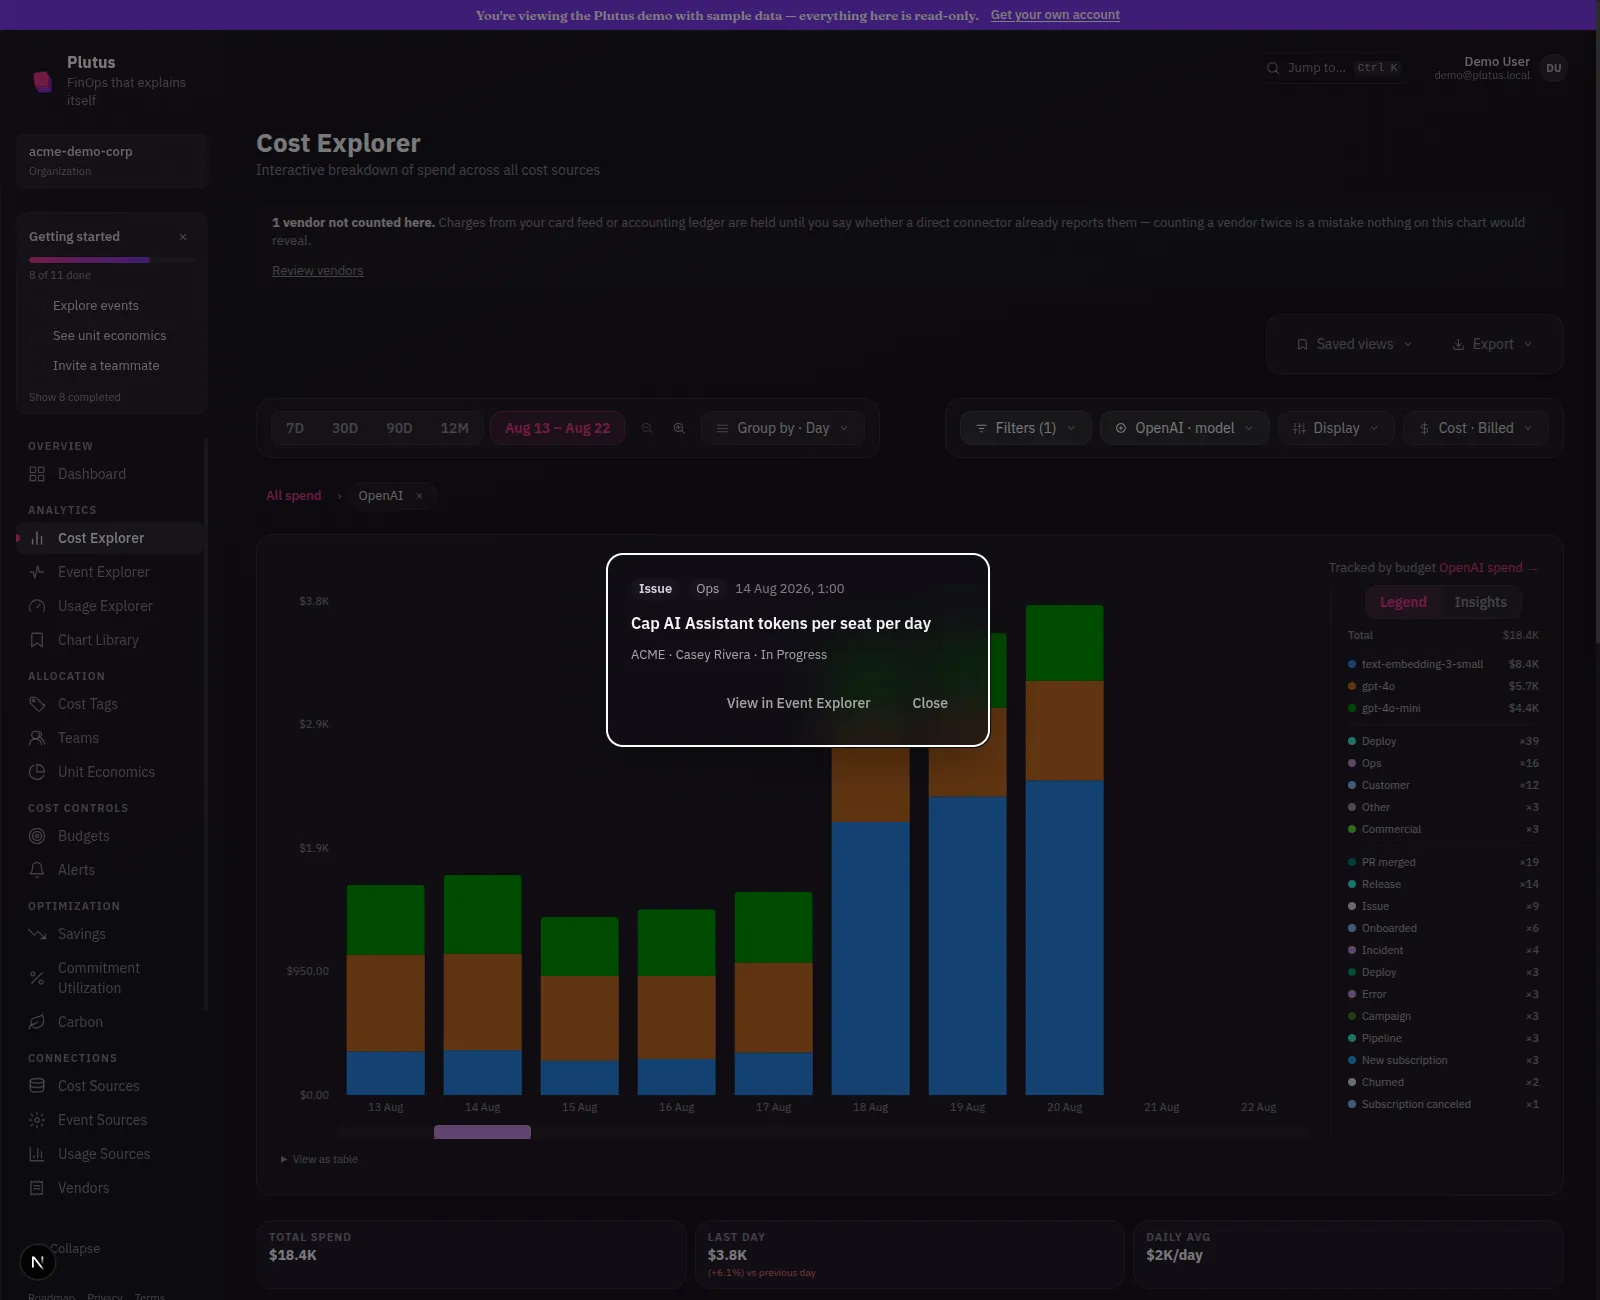
Filed the day before the real climb starts. Status: In Progress. Somebody had already caught this and opened a ticket to fix it, and the fix just hadn’t shipped yet while spend kept building for a few more days. That’s a much better place to be than staring at an unexplained spike, and it’s context a bare cost line simply can’t carry on its own.
One more check. A ticket about capping AI Assistant tokens should mean the AI Assistant itself was getting used more, so head over to Usage Explorer and filter to the account’s own telemetry.
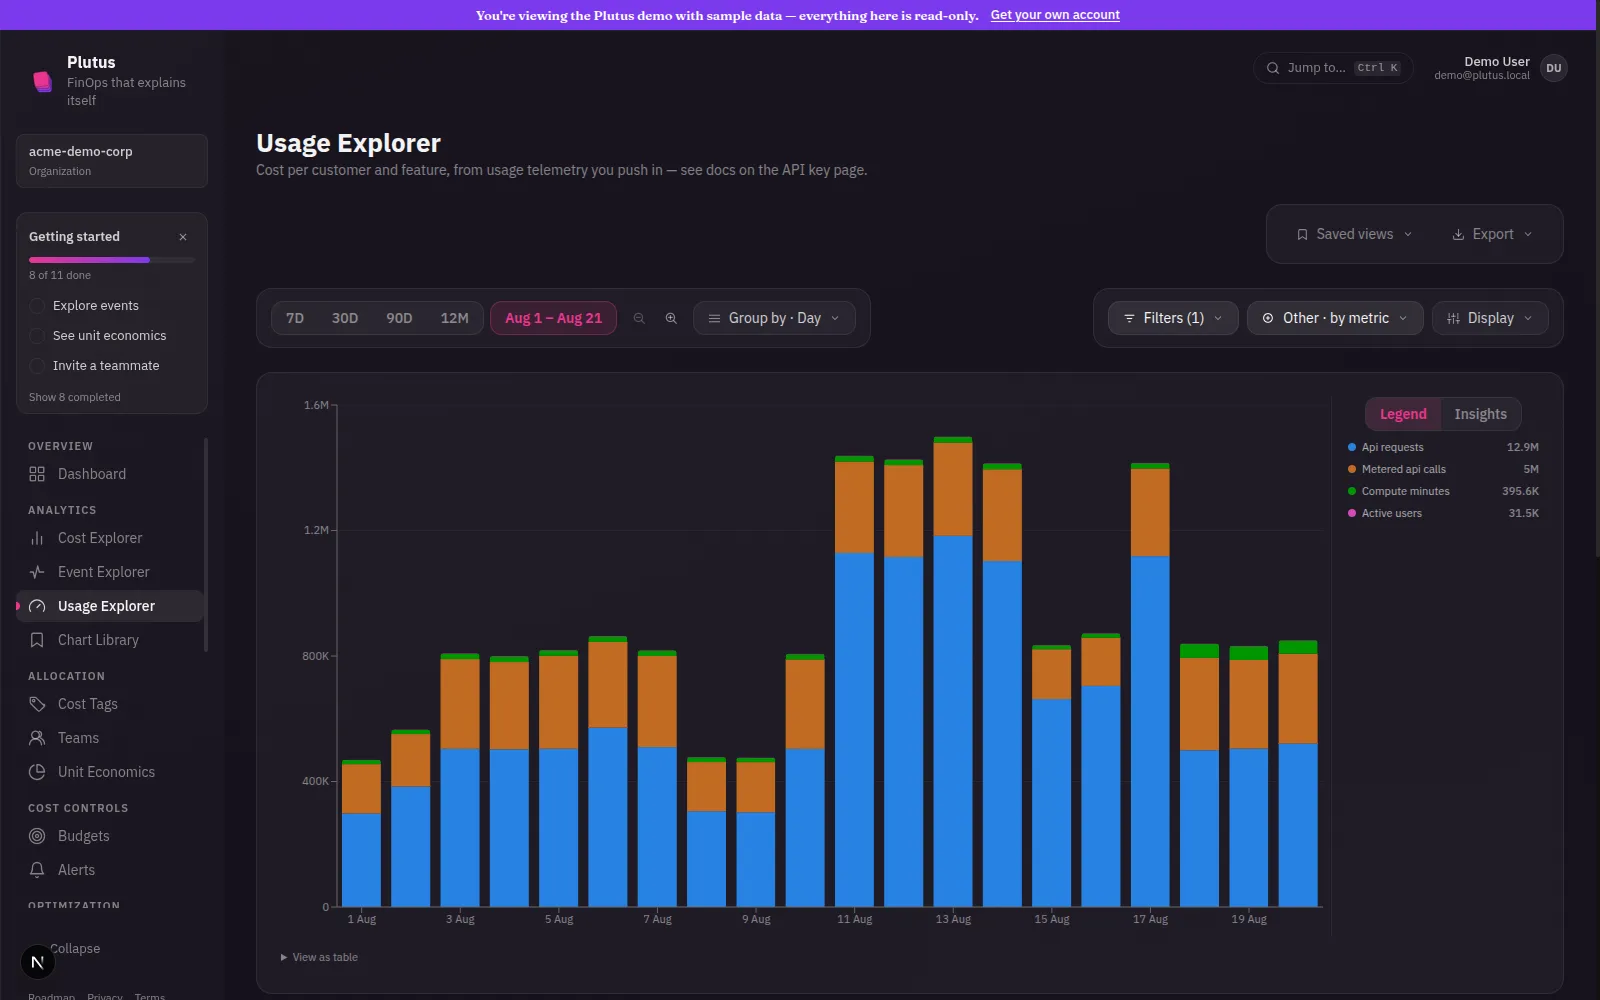
Same days, same shape: API requests and active users step up together, right alongside the spend. That’s not a coincidence in timing, it’s the mechanism laid out plainly. More people using the assistant meant more embedding calls, which meant more spend, and someone had already spotted it and started on a fix before it ever needed to become an alert.
You don’t actually have to click through any of that, though. Plutus also runs an MCP server, so any AI assistant that’s connected to it can just be asked directly. To see how honestly that holds up, we opened a brand-new agent with no context about this account and no hints about what to look for, and gave it one plain question a person might actually type.
Found it. Your OpenAI bill spiked because of text-embedding-3-small costs, not the chat models: gpt-4o and gpt-4o-mini stayed flat around $600 to $800 a day the whole time. The embedding model normally runs about $280 to $340 a day, but it jumped to $2,101 on Aug 18, $2,296 on Aug 19, and $2,420 on Aug 20, roughly a 7 to 8x increase, and the anomaly detector flagged both the Aug 14 (+186%) and Aug 20 (+618%) spikes.
The likely root cause: there's a Sentry error from Aug 12 titled "Retry storm in RAG indexer re-embedded the entire corpus," with the culprit lib/ai/embed-corpus.js in reindexAll, in the worker project. That points squarely at a bug in the RAG indexing job, a retry loop that kept re-embedding the whole document corpus instead of just new or changed docs, which lines up almost exactly with the embedding-cost blowup a few days later. There was also a Jira issue created right around the Aug 14 spike, though the confidence on that correlation is only medium. Worth checking whether reindexAll got stuck retrying or was triggered repeatedly; that's almost certainly where the extra ~$1,800 a day is coming from.
That’s not a shorter retelling of the walkthrough above, either. It surfaced something the dashboard and charts never put in front of us: a Sentry error from a retry storm in the RAG indexer, days before spend even moved, pointing straight at the code path responsible. Same account, same incident, a completely different data source landing on a cause that corroborates rather than just repeats the story.
A dashboard card that already names the ticket. A chart that narrows it to one model. An event popover with the ticket’s status, no search required. A second data source confirming the mechanism rather than just the timing. An MCP server that answers the same question in one sentence, if you’d rather not click through any of it.
No deploy log to cross-reference. No Slack thread. Nobody to ask what shipped last Tuesday.
Try it yourself in the live demo →, or get started free. No credit card required.